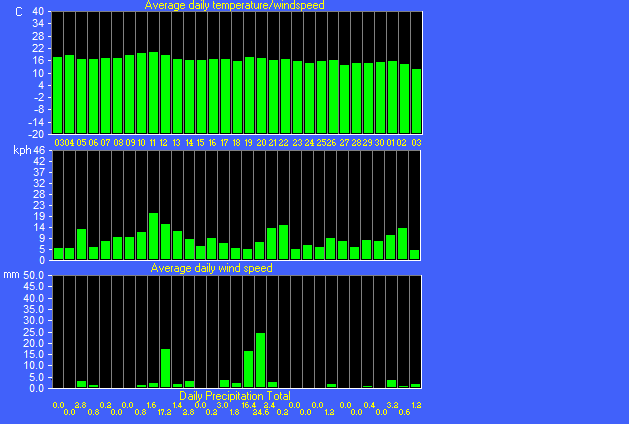
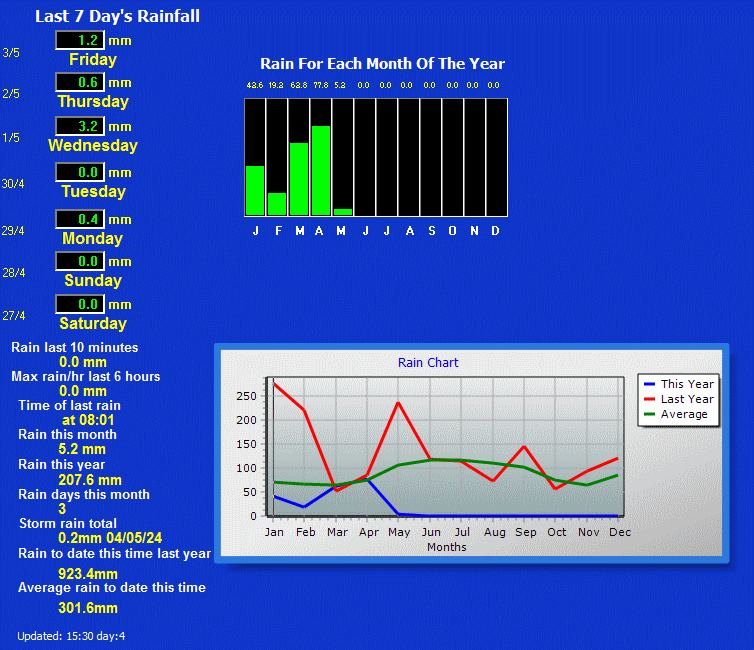
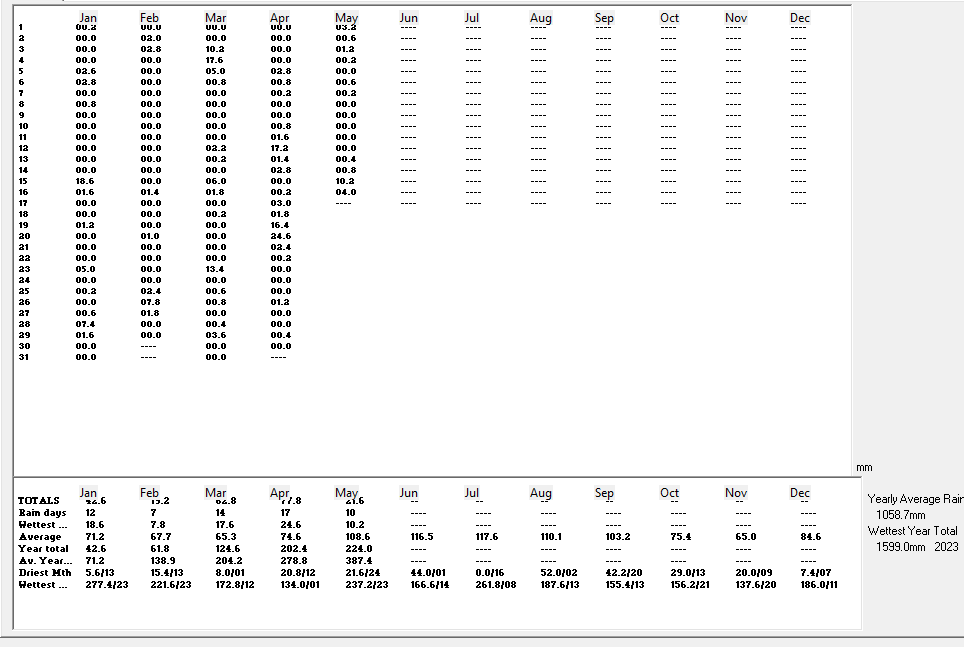
The next tables shows rain details by month for the
current year
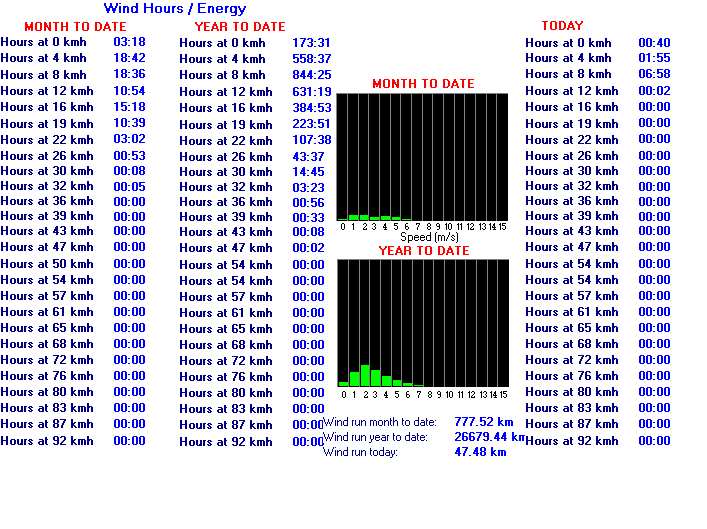
The next graph shows the wind strength by direction for the
month to date
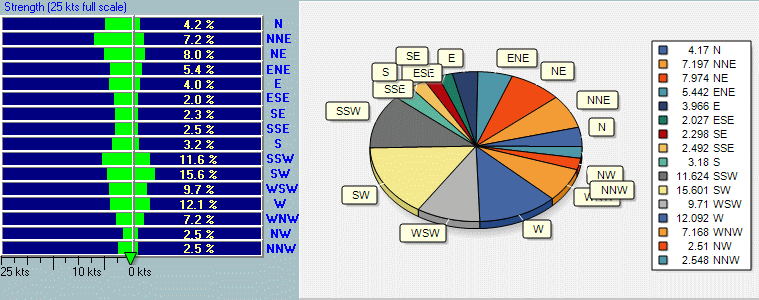
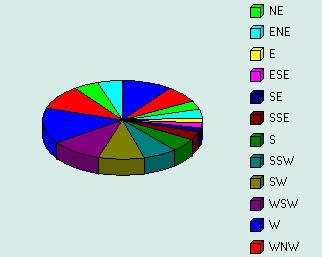
The next graphics shows the month to date
wind speed for each direction.
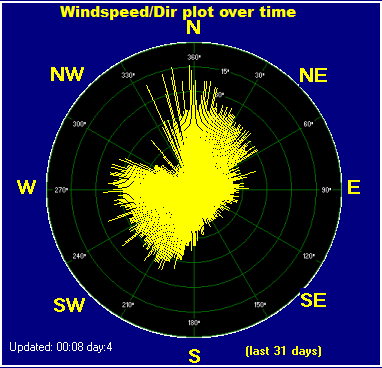
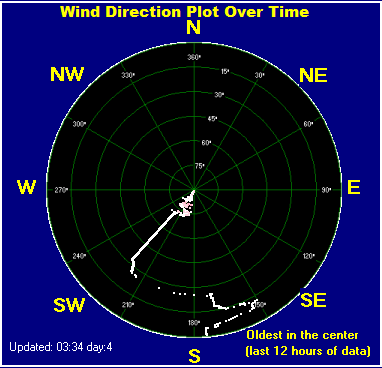
The next graphic shows wind direction over the last 12 hours. The
oldest is in the centre.
